

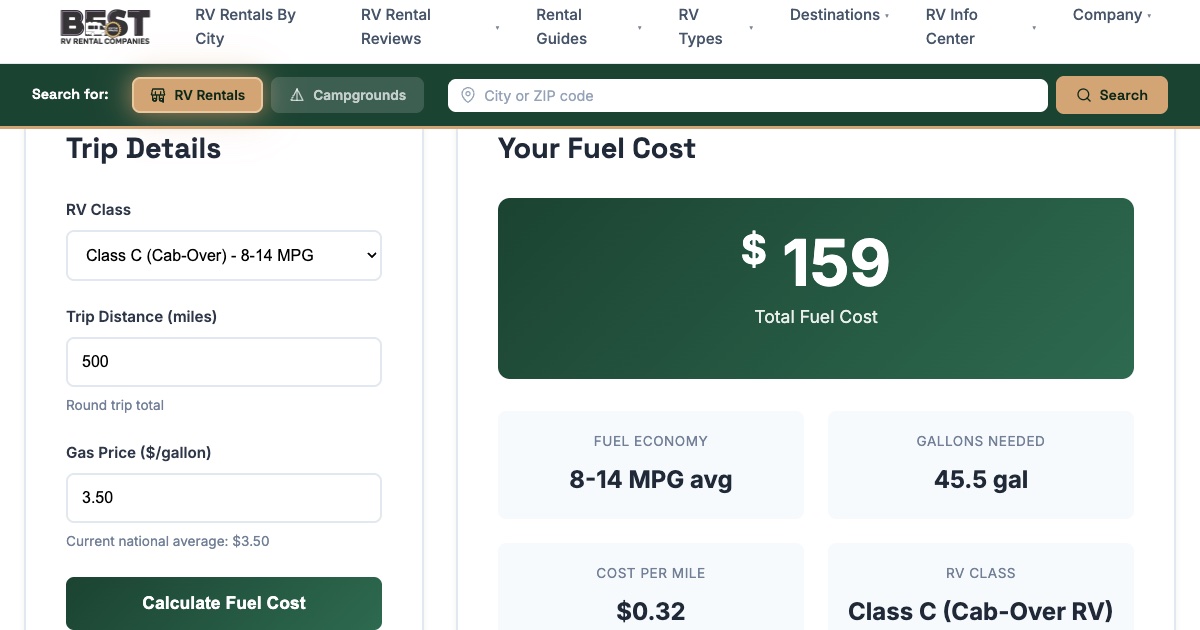
Between June 24 and July 21, 2026, one fuel cost calculator on bestrvrentalcompanies.com earned 105 of the site’s 390 Google clicks, or 27%. In the same 28 days, the 53 city pages I had generated with Claude Code earned 68 clicks between them.
This post is the breakdown of that Search Console export: which page types earned clicks, why one tool beat a whole programmatic batch, and what I would build first if I started the site again.
What is bestrvrentalcompanies.com, and how was it built?
It is my RV rental review and comparison site, built in Astro and hosted on Vercel. The repository has 387 commits between November 4, 2025 and September 23, 2026. 361 of them carry a Co-Authored-By Claude line.
The fuel cost estimator shipped on November 14, 2025, ten days after the first commit. It went in on the same day as three other tools: an RV size recommender quiz, a mileage allowance calculator and a packing checklist. Up to the end of the export window, six commits had touched the calculator file. In the same period, 81 commits touched the city pages.
The city pages came from a template. The generation doc in the repo describes the method plainly: it “Loads Alexander AR as template” and runs a “Smart find-and-replace for city-specific data.” On December 20, 2025, a separate commit fixed trailing-slash canonicals after Search Console reported “Alternate page with proper canonical tag” errors. That fix landed six months before the export window. I have no indexing report from the window itself, so I treat the comparison below as one about content.
Which pages actually earned the clicks?
The export lists 269 URLs with impressions. 194 of them, 72%, got zero clicks. Half of all clicks went to just six URLs. I sorted every URL into a page type and totalled each group.
| Page type | URLs with impressions | Clicks | Share of 390 | Impressions | CTR | URLs with 0 clicks |
|---|---|---|---|---|---|---|
| Fuel cost calculator | 1 | 105 | 26.9% | 8,498 | 1.24% | 0 |
| Reviews | 8 | 89 | 22.8% | 29,463 | 0.30% | 1 |
| City pages | 45 | 68 | 17.4% | 26,178 | 0.26% | 22 |
| Blog | 9 | 50 | 12.8% | 9,769 | 0.51% | 2 |
| Campgrounds | 17 | 21 | 5.4% | 6,599 | 0.32% | 8 |
| Compare | 4 | 17 | 4.4% | 3,061 | 0.56% | 2 |
| Rentals | 30 | 10 | 2.6% | 600 | 1.67% | 21 |
| Other tools | 3 | 5 | 1.3% | 131 | 3.82% | 2 |
| Glossary | 78 | 4 | 1.0% | 1,438 | 0.28% | 74 |
| Home | 1 | 0 | 0% | 163 | 0% | 1 |
| Everything else | 73 | 22 | 5.6% | 4,436 | 0.50% | 61 |
Page-level rows sum to 391 clicks, one more than the 390 in the chart. Google’s own help page says chart and table totals can differ because of how each is aggregated. The 45 city URLs are really 44 pages, because Las Vegas appears once with a trailing slash and once without.
The repo had 53 city pages live in that window. Nine had no impressions at all, and 22 more had impressions but no clicks. So 30 of 53 city pages earned nothing. The calculator earned 105 clicks alone. Averaged across all 53, a city page earned about 1.3 clicks in 28 days.
Google’s people-first content guide asks: “Does the content provide substantial value when compared to other pages in search results?” This table is that question answered with clicks, page type by page type. Before you generate the next batch of anything, build this table for your own site. Without it, you keep adding to the group that earns 1.3 clicks a page because generating it is cheap.
Did the calculator win because it ranked higher?
Partly, but position does not explain most of it. The calculator averaged position 7.11. Four review URLs sat close to it: Cruise America at 7.56, RVshare at 7.88, Outdoorsy at 8.22 and the reviews index at 8.32. Together they had 25,501 impressions and 74 clicks, a CTR of 0.29%.
The calculator converted at 1.24%, about four times that rate at a similar position. At the review pages’ rate, its 8,498 impressions would have produced about 25 clicks, not 105.
The Google guide asks whether a reader will “leave feeling they’ve learned enough about a topic to help achieve their goal.” The searcher behind “how much does it cost to fill up an rv” has one goal: a dollar figure for a trip. The calculator gives one. You pick an RV class, enter trip miles and a gas price, and it returns gallons, total cost, cost per mile and the same trip in every other class.
When you compare page types, compare CTR at matched positions, not total clicks. A page type that converts four times better at position 7 is the one to build more of. If you only read total clicks, you will credit the pages with the most impressions and miss the page that converts.
What went wrong with the generated city pages?
Find-and-replace templating leaves residue. On April 19, 2026, a commit cleaned “Arkansas template residue” off nine city pages. On July 23, 2026, another found that the Apache Junction, Arizona page still carried Arkansas data: “stateAbbr AR in title+schema, AR ZIP, Ozark FAQ text.”
The same week, the commits show a clean-up campaign across the batch. Claude and I deduplicated template sections page by page, stripped generic list sections from 24 city pages, and purged “fabricated experience” from all of them. One commit message reads “agents hit session cap mid-run.” Another salvaged seven pages the agents wrote but never committed before hitting that cap. Between July 22 and July 25, 53 commits touched the city pages.
Google’s spam policies define scaled content abuse as “creating large amounts of unoriginal content that provides little to no value to users, no matter how it’s created.” The doorway abuse section lists “pages targeted at specific regions or cities that funnel users to one page.” A city page cloned from Arkansas, with an Arkansas ZIP on an Arizona page, sits close to both descriptions, whatever my intent was.
If you generate location pages from a template, lint every page for the source city’s name, state, ZIP and airport code before it ships. Then gate generation on real local data you hold. The cost of skipping both is a batch that reads as one page with the nouns swapped, plus a week of clean-up commits. On this site, that clean-up came after 30 of the 53 pages had already earned nothing.
So should every site just build calculators?
No, and this is the part most people will get wrong from the headline. Four tools shipped on November 14, 2025. Only one of them shows up in the export. The mileage allowance calculator, the packing checklist and the RV size recommender have no rows at all. That means no impressions in 28 days, seven months after launch.
The export is not truncated here. It holds 269 page rows, well under the 1,000-row cap. Those three tools were built by the same process, on the same day, and received nothing.
The difference is the question. The visible query rows include 35 distinct ways of asking about RV fuel cost, from “rv gas calculator” to “how much does it take to fill up a rv.” I found no query for a packing checklist or a mileage allowance. The size queries were mostly about which company offers the most sizes, plus “rv sizes” with 65 impressions, and none asked for a quiz. Google’s guide warns against “producing lots of content on many different topics in hopes that some of it might perform well in search results.” That applies to tools exactly as it applies to city pages.
Build a tool only after you have evidence that people are asking the question it answers. A tool without that demand performs like my glossary: 78 URLs, 4 clicks.
The calculator is also not sophisticated. Its MPG ranges and its $3.50 default gas price are typed into the page by hand. Its subtitle still says “real MPG data from 50+ rentals,” a figure the site lowered to 25+ everywhere else on July 23, 2026. It won by answering the question, not by being clever, and it has its own fixes waiting.
Which searches sent people to the calculator?
Mostly searches I cannot see. This standard export does not join queries to pages, and its query table is thin. Its 1,000 query rows account for 49 of the 390 clicks, about 13%.
The 35 fuel-cost queries I could see total 718 impressions and one click, from “motorhome fuel calculator.” The calculator page itself had 8,498 impressions. So at least 91% of its impressions came from searches that are not in this export.
Google’s Search Console data deep dive explains both gaps. Anonymized queries “aren’t issued by more than a few dozen users over a two-to-three month period,” and the interface export stops at 1,000 rows. A fuel calculator draws exactly that kind of traffic: many small phrasings, each one rare.
Do not plan content from the site-wide queries tab. Filter the Performance report by page, or pull page and query together through the API. If you read only the export, the top query is “rv rental” with 3 clicks, and you would optimize for it while your best page goes unexplained.
What does this data not show?
- It is one 28-day window from one export. I have no earlier or later Search Console export for this site, so I cannot show a trend or a before-and-after for the July city clean-up.
- It shows clicks, not money. There is no revenue or affiliate conversion data in this export, so I make no claim that the calculator earned more than any other page.
- Average position is an average across many queries. The matched-position comparison is a fair check, not a controlled test.
- The page types are my own classification of URL paths. The counts come from the repo as it stood during the window.
What should you do before generating your next 50 pages?
- Export your last 28 days of Performance data and sort every URL into a page type. Total clicks, impressions and zero-click URLs for each type.
- Compare CTR between page types at similar average positions. Find the type that converts. The type with the most impressions is often a different one.
- Filter the Performance report by your best page and read its queries there. Write down the question those searchers are asking.
- Before building any tool, find at least a handful of distinct queries asking for its answer. No queries, no tool.
- If you still generate location pages, lint each one for leftover template names, states and ZIPs. Ship only the cities where you hold real local data.
- Put your next week into the page type that earns, and repeat the table in 28 days.
Before generating pages, see how a programmatic SEO quality gate blocks thin pages and how to audit AI-written blog posts you already have.
Sources
- Google Search Central, Creating helpful, reliable, people-first content (page updated 2026-10-05).
- Google Search Central, Spam policies for Google web search, scaled content abuse and doorway abuse (page updated 2026-08-28).
- Google Search Central Blog, A deep dive into Search Console performance data filtering and limits (October 19, 2022).
- Google Search Console Help, Performance report (Search results), on chart and table totals.
- Google Search Console export for www.bestrvrentalcompanies.com, web search, June 24 to July 21, 2026.
- The bestrvrentalcompanies.com repository and live calculator page, checked October 8, 2026.


